Use the SUMXMY2 Function in Excel for Statistical Analysis
Excel is a powerful tool for data analysis, and one of its many useful functions is the SUMXMY2 function. This function allows you to calculate the sum of the squares of the differences between two arrays of numbers. In this blog post, we'll take a closer look at what the SUMXMY2 function does and how you can use it in your data analysis.
What is the SUMXMY2 Function?
The SUMXMY2 function is a statistical function in Excel that calculates the sum of the squares of the differences between two arrays of numbers. The syntax of the function is as follows:
Syntax
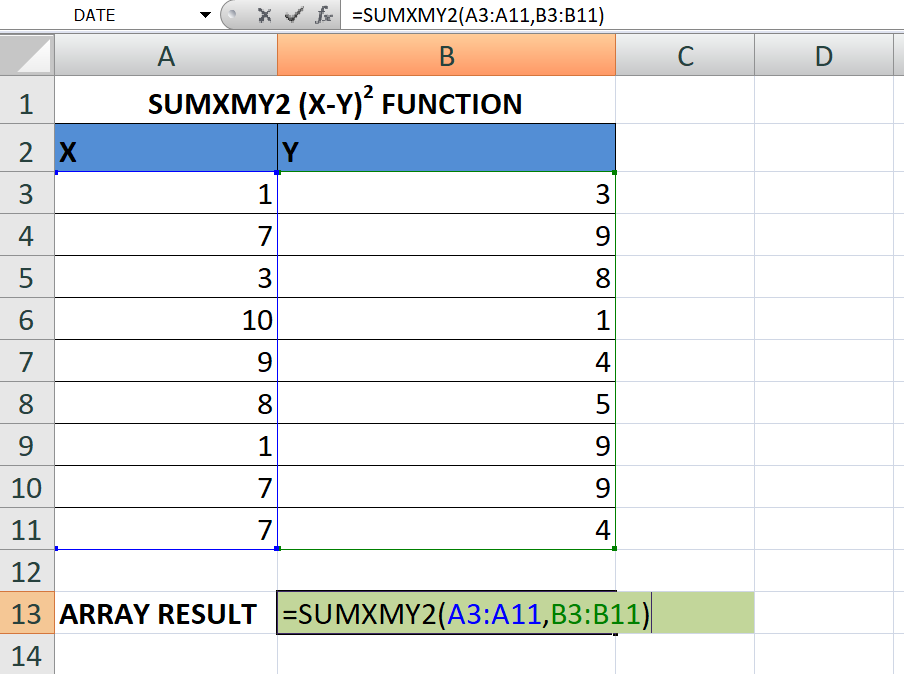
=SUMXMY2(array_x, array_y)
Where:
- array_xis an array or range of values representing the x-coordinates of the data points.
- array_yis an array or range of values representing the y-coordinates of the data points.
The SUMXMY2 function returns the sum of the squared differences between the corresponding values in array_x and array_y.
The formula used by the SUMXMY2 function is:
SUMXMY2(array_x, array_y) = SUM((array_x - array_y)^2)
Here, ^ represents the exponentiation operator.
How to Use the SUMXMY2 Function in Excel
To use the SUMXMY2 function in Excel, you first need to select the cell where you want the result to be displayed. Then, enter the function into the cell, using the appropriate range references for array_x and array_y.
For example,
if your x-values are in the range A1:A11 and your y-values are in the range B1:B11, you would enter the following function:
=SUMXMY2(A1:A11, B1:B11)
Output
Press Enter to calculate the result, and the cell will display the sum of the squared differences between the corresponding values in A1:A11 and B1:B11.
You can use the SUMXMY2 function to calculate a variety of statistics, such as the variance of a dataset, or the sum of squares for a regression model. It is particularly useful in linear regression analysis, where it is used to calculate the residual sum of squares (RSS), which is a measure of how well the regression line fits the data.
Conclusion
The SUMXMY2 function is a powerful tool for data analysis in Excel. It allows you to easily calculate the sum of the squared differences between two arrays of numbers, which can be used to calculate various statistics and perform linear regression analysis. By understanding how to use the SUMXMY2 function, you can gain valuable insights into your data and make more informed decisions based on your analysis.
Learn All in Tamil © Designed & Developed By Tutor Joes | Privacy Policy | Terms & Conditions