Excel Essentials: A Beginners Guide to Spreadsheets Data Management
Microsoft Excel is a powerful and widely used spreadsheet software developed by Microsoft Corporation. It is a part of the Microsoft Office suite and is designed to help users create, organize, and analyze data in a structured manner. With Excel, users can perform various tasks related to data management, calculation, visualization, and reporting.
Excel's main interface consists of a grid-like structure, where data is organized into cells arranged in rows and columns. Each cell can hold different types of information, such as text, numbers, dates, and formulas. Formulas and functions allow users to perform complex calculations and automate tasks, making Excel an essential tool for financial analysis, budgeting, data analysis, and more.
Data analysis is made accessible through Excel's powerful features like sorting, filtering, and pivot tables. Pivot tables, in particular, enable users to summarize and analyze large datasets quickly, providing valuable insights and trends within the data.
Visualization is another key strength of Excel. Users can create various types of charts and graphs to represent data visually, helping them present information in a compelling and easy-to-understand manner.
Excel also offers features like data validation to maintain data accuracy, conditional formatting to highlight important information, and the ability to import and export data from various sources.
Furthermore, Excel is known for its compatibility and integration with other Microsoft Office applications like Word and PowerPoint, allowing seamless data transfer and collaboration
Whether you're a professional, student, or business user, Microsoft Excel serves as an indispensable tool for data organization, analysis, and reporting. Its versatility, user-friendly interface, and array of features make it a go-to application for individuals and organizations seeking to make informed decisions and gain valuable insights from their data.
Advantages of Excel 365
- Always Up-to-Date: Excel 365 is part of the Microsoft 365 suite, which means you receive regular updates, bug fixes, and new features automatically. This ensures you're using the latest version with improved functionalities.
- Cloud Integration: Excel 365 allows you to store your files in the cloud using OneDrive or SharePoint. This enables easy access to your spreadsheets from anywhere and on various devices, promoting collaboration and data sharing.
- Real-time Collaboration: Multiple users can work on the same Excel file simultaneously. Changes are synchronized in real-time, enhancing team collaboration and reducing version conflicts.
- Advanced Features: Excel 365 often receives new features and enhancements faster than standalone versions. This includes improved data analysis tools, new chart types, and AI-powered functionalities.
- Access to Other Apps: Subscribing to Excel 365 gives you access to the entire Microsoft 365 suite, which includes applications like Word, PowerPoint, Outlook, Teams, and more, facilitating a comprehensive and integrated workflow.
- Mobile Apps: Excel 365 offers mobile apps for various platforms, allowing you to work on your spreadsheets from smartphones and tablets.
Disadvantages of Excel 365:
- Subscription Cost: Excel 365 is subscription-based, meaning you have to pay an ongoing fee to use the software. This cost can add up over time, especially for businesses or individuals on tight budgets.
- Internet Dependency: While cloud integration is an advantage, it also means you need a stable internet connection to access your files and use certain features. Offline access might be limited.
- Privacy Concerns: Storing sensitive data on cloud services might raise privacy and security concerns for some users. While Microsoft employs robust security measures, some individuals and organizations might prefer keeping data strictly on-premises.
- Learning Curve: New features introduced through updates might require users to adapt and learn new functionalities. This could be challenging for those accustomed to older versions of Excel.
- Compatibility Issues: Collaborating on files with users who have different versions of Excel or even other spreadsheet software might lead to formatting or compatibility issues.
- Data Protection and Ownership: When using cloud services like OneDrive, there could be concerns about data ownership and control, especially for businesses dealing with sensitive information.
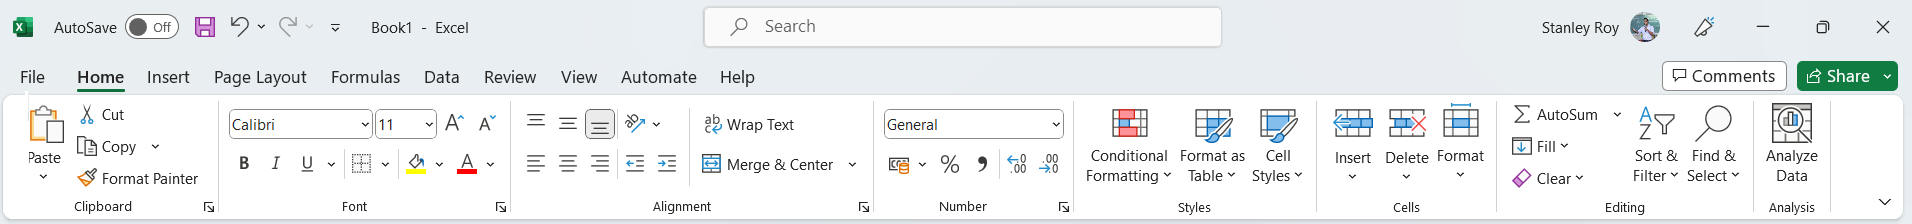
Ribbon Menu
In Excel 365, the conventional menu structure found in traditional software has been replaced by the ribbon interface. The ribbon serves as a modern and visually engaging way to access Excel's features and functions. While not the traditional menus you might be accustomed to, the ribbon retains similar functions while enhancing usability.
Here's how the ribbon functions as an evolved menu system:
- Tabs: Think of tabs as overarching menu categories. Each tab represents a different area of functionality, such as "Home," "Insert," "Formulas," and more. Just like menus, tabs group related commands and functions together for easy access.
- Groups: Within each tab, you'll discover groups that function similarly to submenus. Groups gather related commands and options under a single heading. For instance, the "Font" group in the "Home" tab consolidates all text formatting options.
- Commands: Commands are the equivalent of menu items. They're interactive elements like buttons, checkboxes, and drop-down lists that allow you to execute specific actions. For example, the "Bold" command in the "Font" group functions like the "Bold" option in traditional menus.
- Contextual Menus: In some instances, right-clicking on a specific object like a cell or chart brings up a contextual menu. This menu provides commands pertinent to the selected object, similar to context menus in traditional software.
- Dialog Box Launchers: Certain groups have dialog box launchers denoted by small arrow icons. Clicking these opens more in-depth dialog boxes with advanced settings related to the group's commands, akin to submenus leading to further options.
Although the ribbon format may differ from classic menus, it accomplishes a similar goal—organizing Excel's commands and functions to ensure they're easily accessible. This innovation boosts discoverability and user-friendliness, allowing users to efficiently navigate and utilize Excel 365's array of features.
Excel 365 Enviroment
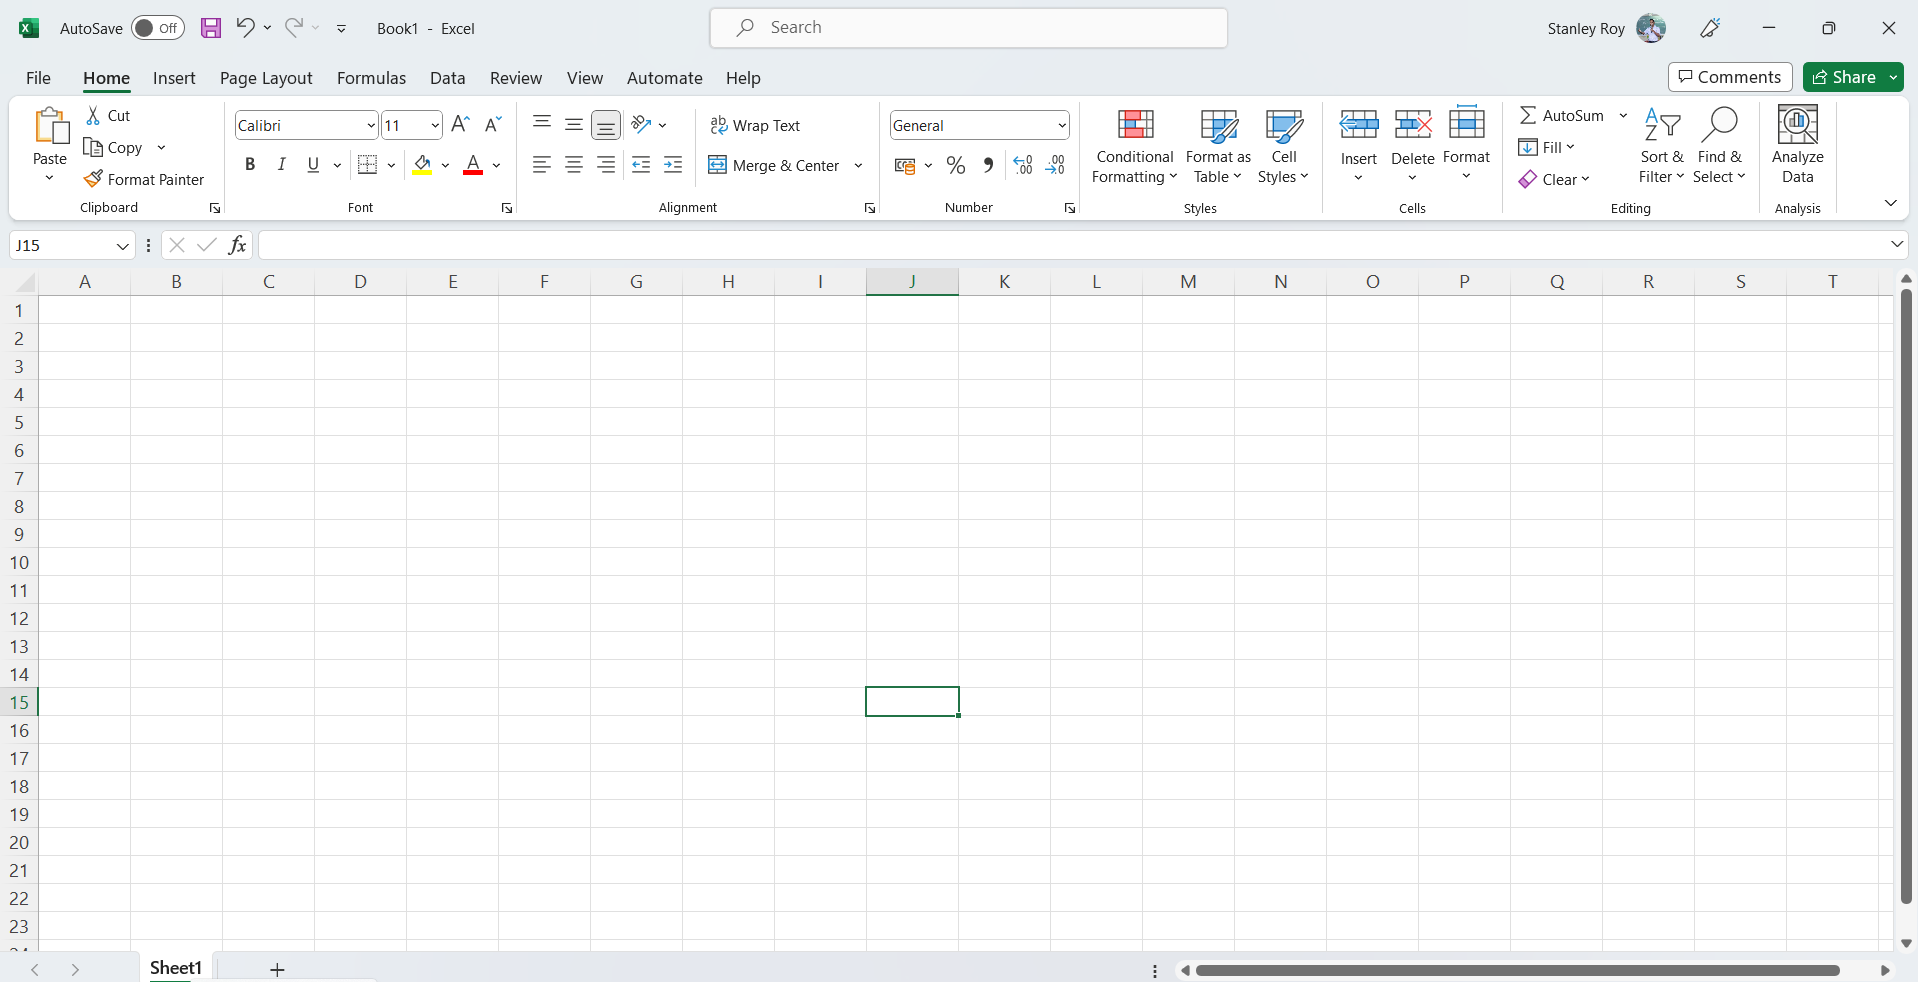
Worksheet
In Microsoft Excel 365, a worksheet refers to a single page within an Excel workbook where you can input, organize, analyze, and present data. A worksheet is essentially a grid of cells that are organized into rows and columns, forming a matrix-like structure. Each cell within the grid can contain different types of information, such as text, numbers, dates, formulas, and more. Here are the key features and components of a worksheet in Excel 365:
- Columns and Rows: The worksheet is divided into columns (labeled with letters A, B, C, and so on) and rows (labeled with numbers 1, 2, 3, and so on). The intersection of a column and a row creates a cell, which is the smallest unit of data storage.
- Cells: Cells are the rectangular boxes formed at the intersections of rows and columns. You can enter data directly into cells, perform calculations, and apply various formatting options to cells.
- Data Entry: You can input data into cells by clicking on a cell and typing the desired content. Cells can hold a wide range of information, from simple text and numbers to more complex formulas.
- Formulas and Functions: Formulas and functions allow you to perform calculations and manipulate data within cells. Formulas are equations you create, while functions are built-in tools that perform specific calculations.
- Formatting: You can format cells to change their appearance, including font style, font size, cell borders, background color, and more. Formatting helps make the data more readable and visually appealing.
- Data Analysis: Excel provides various tools for data analysis, including sorting, filtering, pivot tables, charts, and graphs. These tools help you analyze and present data effectively.
- Sheets: A workbook can contain multiple worksheets, each accessed through tabs at the bottom of the Excel window. Worksheets allow you to organize related data into separate sections within a single workbook.
- Navigation and View Options: Excel offers different views, such as Normal View, Page Layout View, and Page Break Preview, to help you navigate and format your worksheet based on your needs.
- Printing: You can configure how your worksheet is printed by adjusting settings such as margins, orientation, headers, footers, and more.
- Data Presentation: Worksheets can be used to create reports, budgets, schedules, and more. By using features like charts and graphs, you can visually present your data to convey insights effectively.
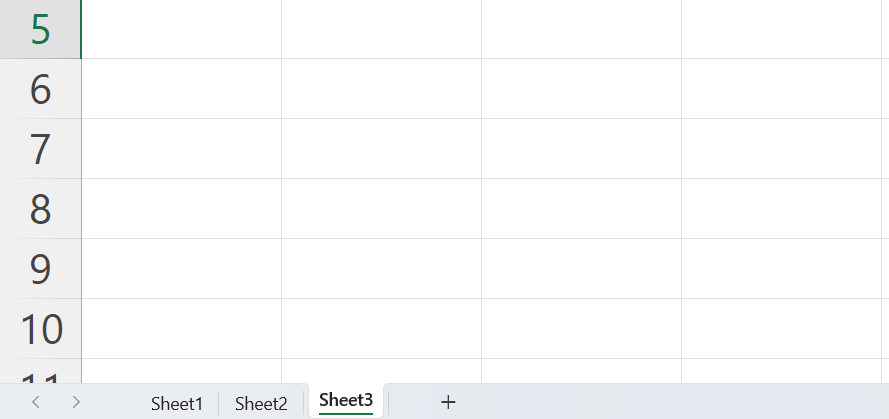
Sheets
In Microsoft Excel, a sheet is often called a worksheet. A sheet is a single page that contains its own collection of cells to help you organize your data. There can be many sheets in your Excel document and you can see the sheets listed as tabs along the bottom of your document.
Type of Sheet in Excel
Microsoft Excel is a spreadsheet application that has been developed and maintained by Microsoft. Using Excel, you can perform a multitude of functions such as run calculations, make lists, and charts. It also helps analyze and sort information, track financial data, and much more.
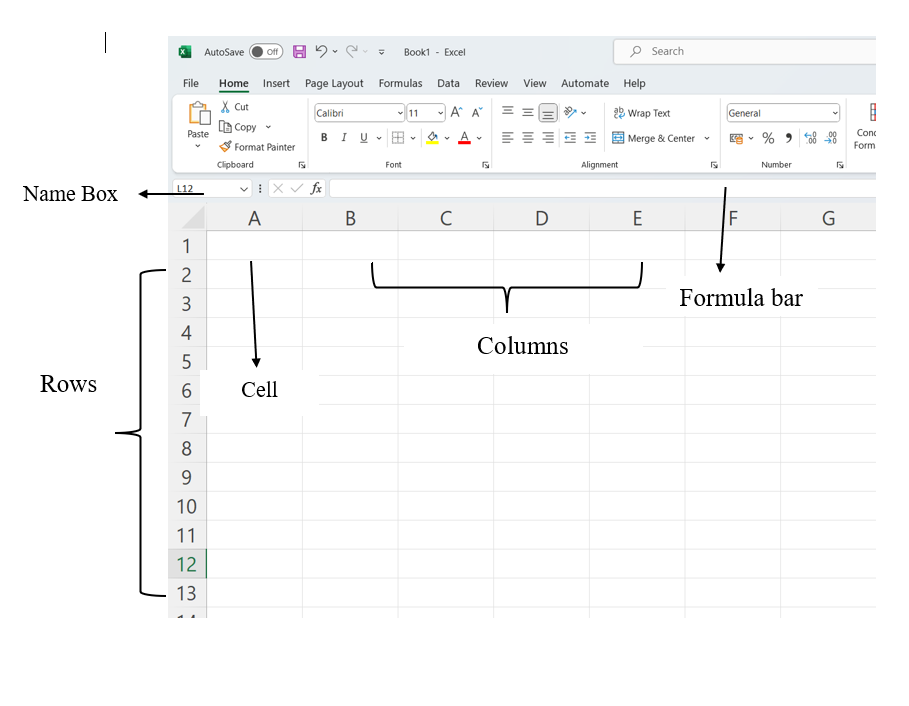
Cell in Excel
In Microsoft Excel, a "cell" is the basic unit of a worksheet where you can enter, store, and manipulate data. Cells are organized in a grid-like fashion, with columns labeled alphabetically (A, B, C, etc.) and rows numbered sequentially (1, 2, 3, etc.). Each cell is identified by a combination of its column letter and row number, such as A1, B2, C3, and so on.
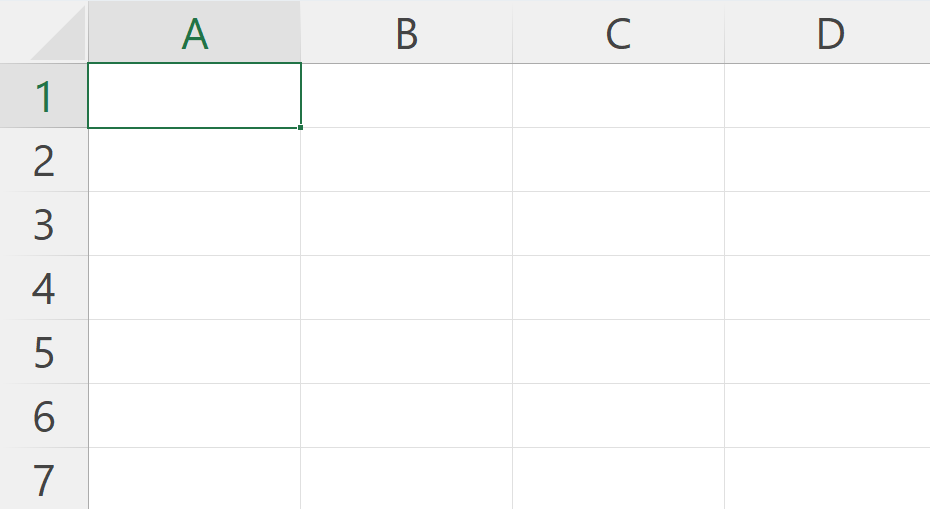
Each cell has its own set of coordinaters or position in the worksheet such as A1,A2 or M16 in the example above we are positioned on cell A1 which is the intersection of column A and row 1. A cell can only store 1 piece od data at a time. You can strore data in a cell such as a formula, text value, numeric value, or date value.
Rows in Excel
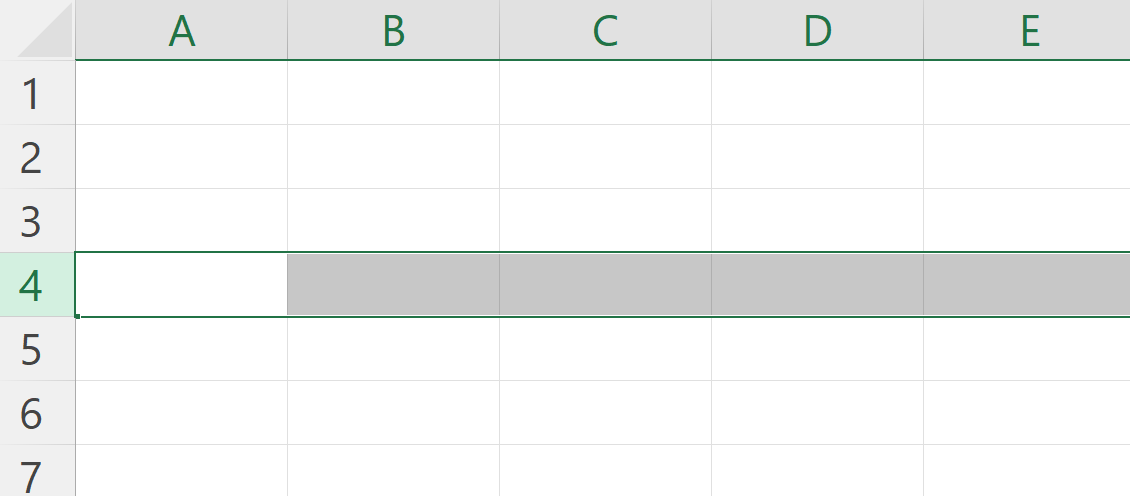
- In Excel, a "row" refers to a horizontal line of cells running from left to right across a worksheet or spreadsheet. Each row is identified by a number along the left side of the spreadsheet, starting with "1" for the first row. Rows are used to organize and display data in a tabular format.
- A row can contain various types of data, such as text, numbers, dates, and formulas. You can enter, edit, and format data within the cells of a row, and you can perform calculations and analysis on the data using Excel's built-in functions and formulas.
- Rows are often used to represent individual records or data points in a dataset. For example, in a sales spreadsheet, each row might represent a different sale transaction with columns for information such as date, customer name, product sold, quantity, price, and total amount.
- You can manipulate rows in various ways in Excel, such as inserting new rows, deleting existing rows, hiding or unhiding rows, and adjusting the height of rows to accommodate different content.
Columns in Excel
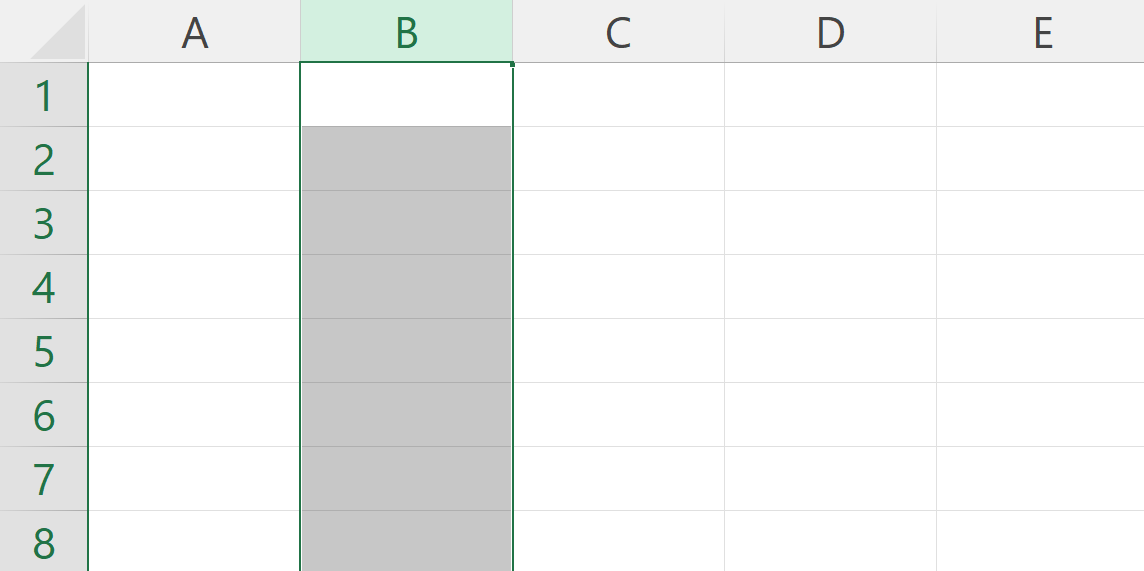
- In Excel, a "column" refers to a vertical series of cells within a worksheet or spreadsheet. Columns are identified by letters at the top of the spreadsheet, typically starting with the letter "A" and progressing alphabetically as you move to the right. Each column is used to organize and store data in a tabular format.
- Columns are used to input and display data, perform calculations, apply formatting, and more. You can manipulate and manage columns in various ways, including resizing them, hiding or unhiding them, freezing them to keep them visible while scrolling through large data sets, and sorting/filtering data within a column to organize information.
Formulas
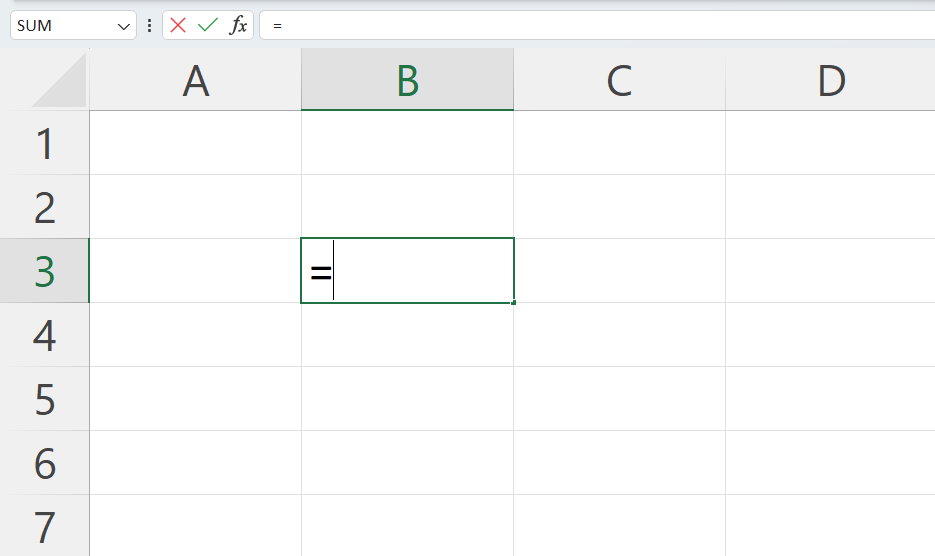
It is simply a statement made up of of 'Operands' and 'Operators'. It helps to calculate ad display results from data entered into its cells. Formulas can be simple arthmetical formulas or coplicated formulas involving conditional statements and nested functions.
A formula always starts with an equal sign (=), which can be followed by number, math operators (like a + or - sign for addition or subtraction), and built-in excel functions, which can really expand the power of formula
Advance Excel 365
Learn All in Tamil © Designed & Developed By Tutor Joes | Privacy Policy | Terms & Conditions