Understanding SUMX2PY2 Function in Excel
The SUMX2PY2 function in Excel is a statistical function that calculates the sum of the squares of corresponding values in two arrays and then returns the sum of those squares. The two arrays must be of the same length.
Syntax
SUMX2PY2(array_x, array_y)
where:
- array_xis an array or range of values representing the x-coordinates of the data points.
- array_y is an array or range of values representing the y-coordinates of the data points.
The formula used by the SUMX2PY2 function is:
SUMX2PY2(array_x, array_y) = SUM((array_x)^2 + (array_y)^2)
Here, ^ represents the exponentiation operator.
The SUMX2PY2 function can be used to calculate the sum of squares of corresponding values in two arrays, which can be useful in various statistical analyses. For example, it can be used to calculate the variance of a data set, or to calculate the coefficient of determination (r-squared) in linear regression.
Example
=SUMX2PY2(A3:A11,B3:B11)
Output
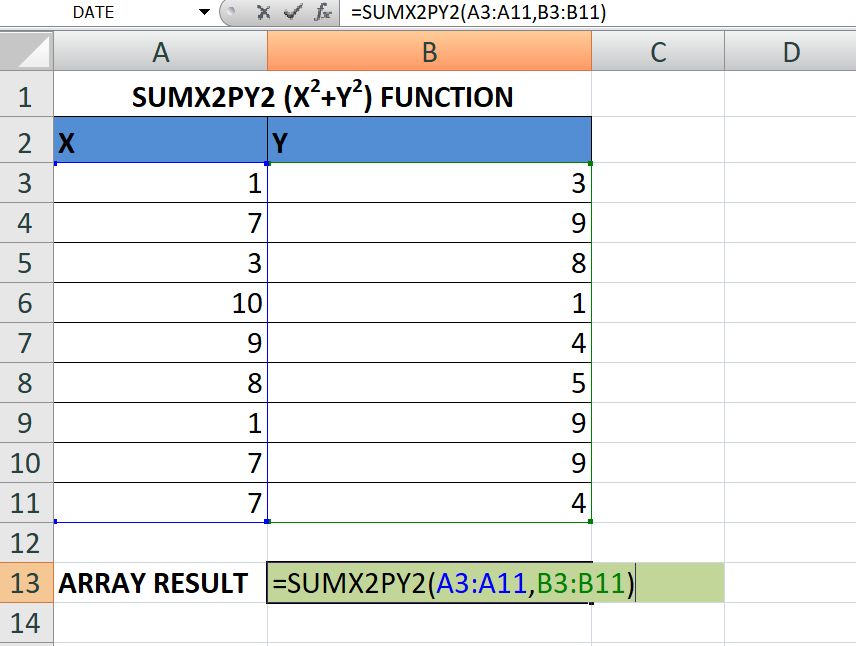
The formula =SUMX2PY2(A3:A11,B3:B11) in Excel calculates the sum of the squares of corresponding values in two arrays, A3:A11 and B3:B11.
In other words, the formula takes each pair of values in cells A3 andB3, squares each value, and then adds the squared values together. It then does the same for each subsequent pair of values in cells A4 and B4, A5 and B5, and so on, up to A11 and B11. Finally, it adds up all the squared values to give the overall sum of the squares of the two arrays..
Learn All in Tamil © Designed & Developed By Tutor Joes | Privacy Policy | Terms & Conditions